Time Between Texts
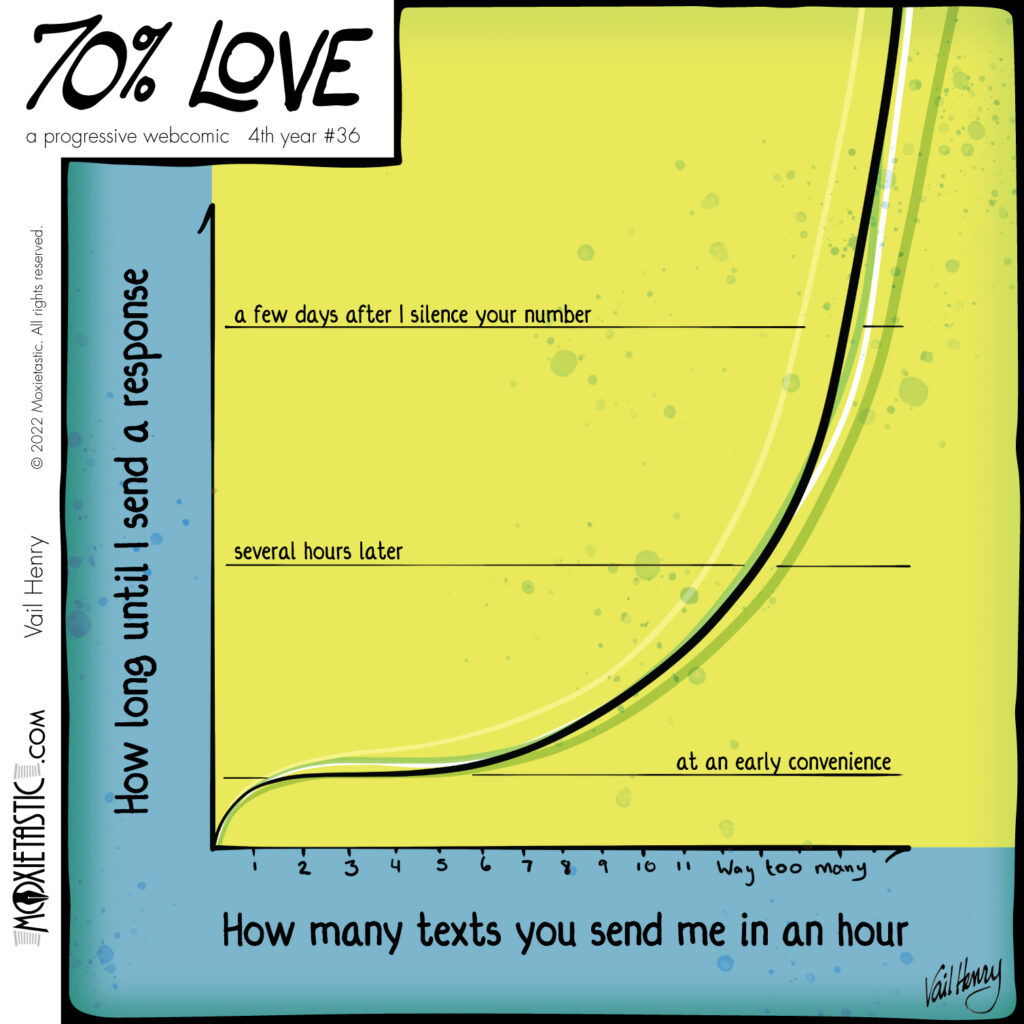
webcomic text:
X-axis of graph: “How many texts you send me in an hour”
Y-axis of graph: “How long until I sent a response”
incremental labels of Y-axis:
“at an early convenience”
“several hours later”
a few days after I silence your number”